Code Challenge: Log Analysis
I interviewed with [REDACTED] and anticipated a coding challenge in round three, so I quickly leveled up my Python skills.

Given a JSON or CSV log file, analyze the data provided and solve each of these scenarios:
- Generate a table of response codes returned for each request.
- Generate a table showing the sum of each response code returned.
- Plot a graph showing the sum of each response code returned.
Analyzing Log Files with Python
To analyze a JSON or CSV log file with Python, we can use Pandas. Pandas DataFrames are two-dimensional tables with labeled axes that are good for analyzing datasets:
- Import the necessary libraries (pandas):
import pandas as pd- Load the log file as a DataFrame. The pandas library has the methods
read_json()andread_csv(), which convert the respective formats into a pandas DataFrame. Thelinesbool reads a JSON log file as one JSON object per line.
data = pd.read_json('nginx.json', lines=True) # read_json() example
data = pd.read_csv('nginx.csv') # read_csv() example- View and analyze the data.
The info method prints information about a DataFrame including the index dtype and columns, non-null values, and memory usage.
print(data.info())describe will generate descriptive statistics which include those that summarize the central tendency, dispersion, and shape of a dataset’s distribution, excluding NaN values.
print(data.describe())To view the first five entries, we can use the head method.
print(data.head())Let's put it all together and see what we get.
import pandas as pd

data = pd.read_csv('nginx.csv') # load csv file as a pandas dataframe
data = pd.read_json('nginx.json', lines=True) # load json file as a pandas dataframe

print(data.info()) # dataframe info
print(data.describe()) # describe dataframe
print(data.head()) # show first 5 entries
<class 'pandas.core.frame.DataFrame'>
RangeIndex: 51462 entries, 0 to 51461
Data columns (total 8 columns):
# Column Non-Null Count Dtype
--- ------ -------------- -----
0 time 51462 non-null object
1 remote_ip 51462 non-null object
2 remote_user 51462 non-null object
3 request 51462 non-null object
4 response 51462 non-null int64
5 bytes 51462 non-null int64
6 referrer 51462 non-null object
7 agent 51462 non-null object
dtypes: int64(2), object(6)
memory usage: 3.1+ MB
None
response bytes
count 51462.000000 5.146200e+04
mean 361.414597 6.595095e+05
std 64.620998 6.518840e+06
min 200.000000 0.000000e+00
25% 304.000000 0.000000e+00
50% 404.000000 3.340000e+02
75% 404.000000 3.380000e+02
max 416.000000 8.637717e+07
time remote_ip remote_user \
0 17/May/2015:08:05:32 +0000 93.180.71.3 -
1 17/May/2015:08:05:23 +0000 93.180.71.3 -
2 17/May/2015:08:05:24 +0000 80.91.33.133 -
3 17/May/2015:08:05:34 +0000 217.168.17.5 -
4 17/May/2015:08:05:09 +0000 217.168.17.5 -
request response bytes referrer \
0 GET /downloads/product_1 HTTP/1.1 304 0 -
1 GET /downloads/product_1 HTTP/1.1 304 0 -
2 GET /downloads/product_1 HTTP/1.1 304 0 -
3 GET /downloads/product_1 HTTP/1.1 200 490 -
4 GET /downloads/product_2 HTTP/1.1 200 490 -
agent
0 Debian APT-HTTP/1.3 (0.8.16~exp12ubuntu10.21)
1 Debian APT-HTTP/1.3 (0.8.16~exp12ubuntu10.21)
2 Debian APT-HTTP/1.3 (0.8.16~exp12ubuntu10.17)
3 Debian APT-HTTP/1.3 (0.8.10.3)
4 Debian APT-HTTP/1.3 (0.8.10.3)Prompt 1
Generate a table of response codes returned for each request.
responses = data[['time','request','response']] # extract requests and responses

print(responses.head()) # output responses
time request response
0 17/May/2015:08:05:32 +0000 GET /downloads/product_1 HTTP/1.1 304
1 17/May/2015:08:05:23 +0000 GET /downloads/product_1 HTTP/1.1 304
2 17/May/2015:08:05:24 +0000 GET /downloads/product_1 HTTP/1.1 304
3 17/May/2015:08:05:34 +0000 GET /downloads/product_1 HTTP/1.1 200
4 17/May/2015:08:05:09 +0000 GET /downloads/product_2 HTTP/1.1 200Prompt 2
Generate a table showing the sum of each response code returned.
count_responses = responses.value_counts(responses['response']) # count response codes

print(count_responses) # ouput counts
response
404 33876
304 13330
200 4028
206 186
403 38
416 4
Name: count, dtype: int64Prompt 3
Plot a graph showing the sum of each response code returned.
import matplotlib.pyplot as plt

# plot graph of count by response code
count_responses.plot.bar(
    title='Count of Response Codes',
    xlabel='Response Codes',
    ylabel='Count'
)

plt.show() # output plot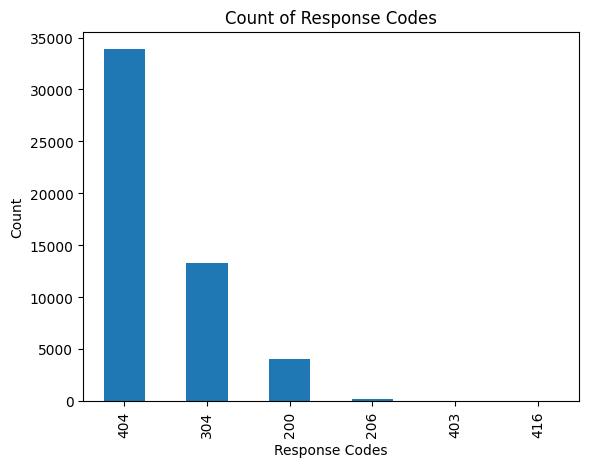
Resources
- https://pandas.pydata.org/docs/getting_started/intro_tutorials/01_table_oriented.html
- https://pandas.pydata.org/docs/getting_started/intro_tutorials/02_read_write.html
- https://pandas.pydata.org/docs/getting_started/intro_tutorials/03_subset_data.html
- https://pandas.pydata.org/docs/getting_started/intro_tutorials/04_plotting.html